No matter if you’re seeking a high-level overview of your campaigns or diving into the specifics of individual performance, our campaign dashboard provides all the tools you need to be in control. These are the features available at both the top-level overview and the detailed campaign-level insights.
Top-level insights
The top-level overview gives you a snapshot of all active campaigns in your account. This intuitive interface lets you quickly assess your campaign, spot trends or patterns, and identify areas that may need attention. By hovering over specific days, weeks, or months, you can see time-specific data points for deeper insights into performance over time.
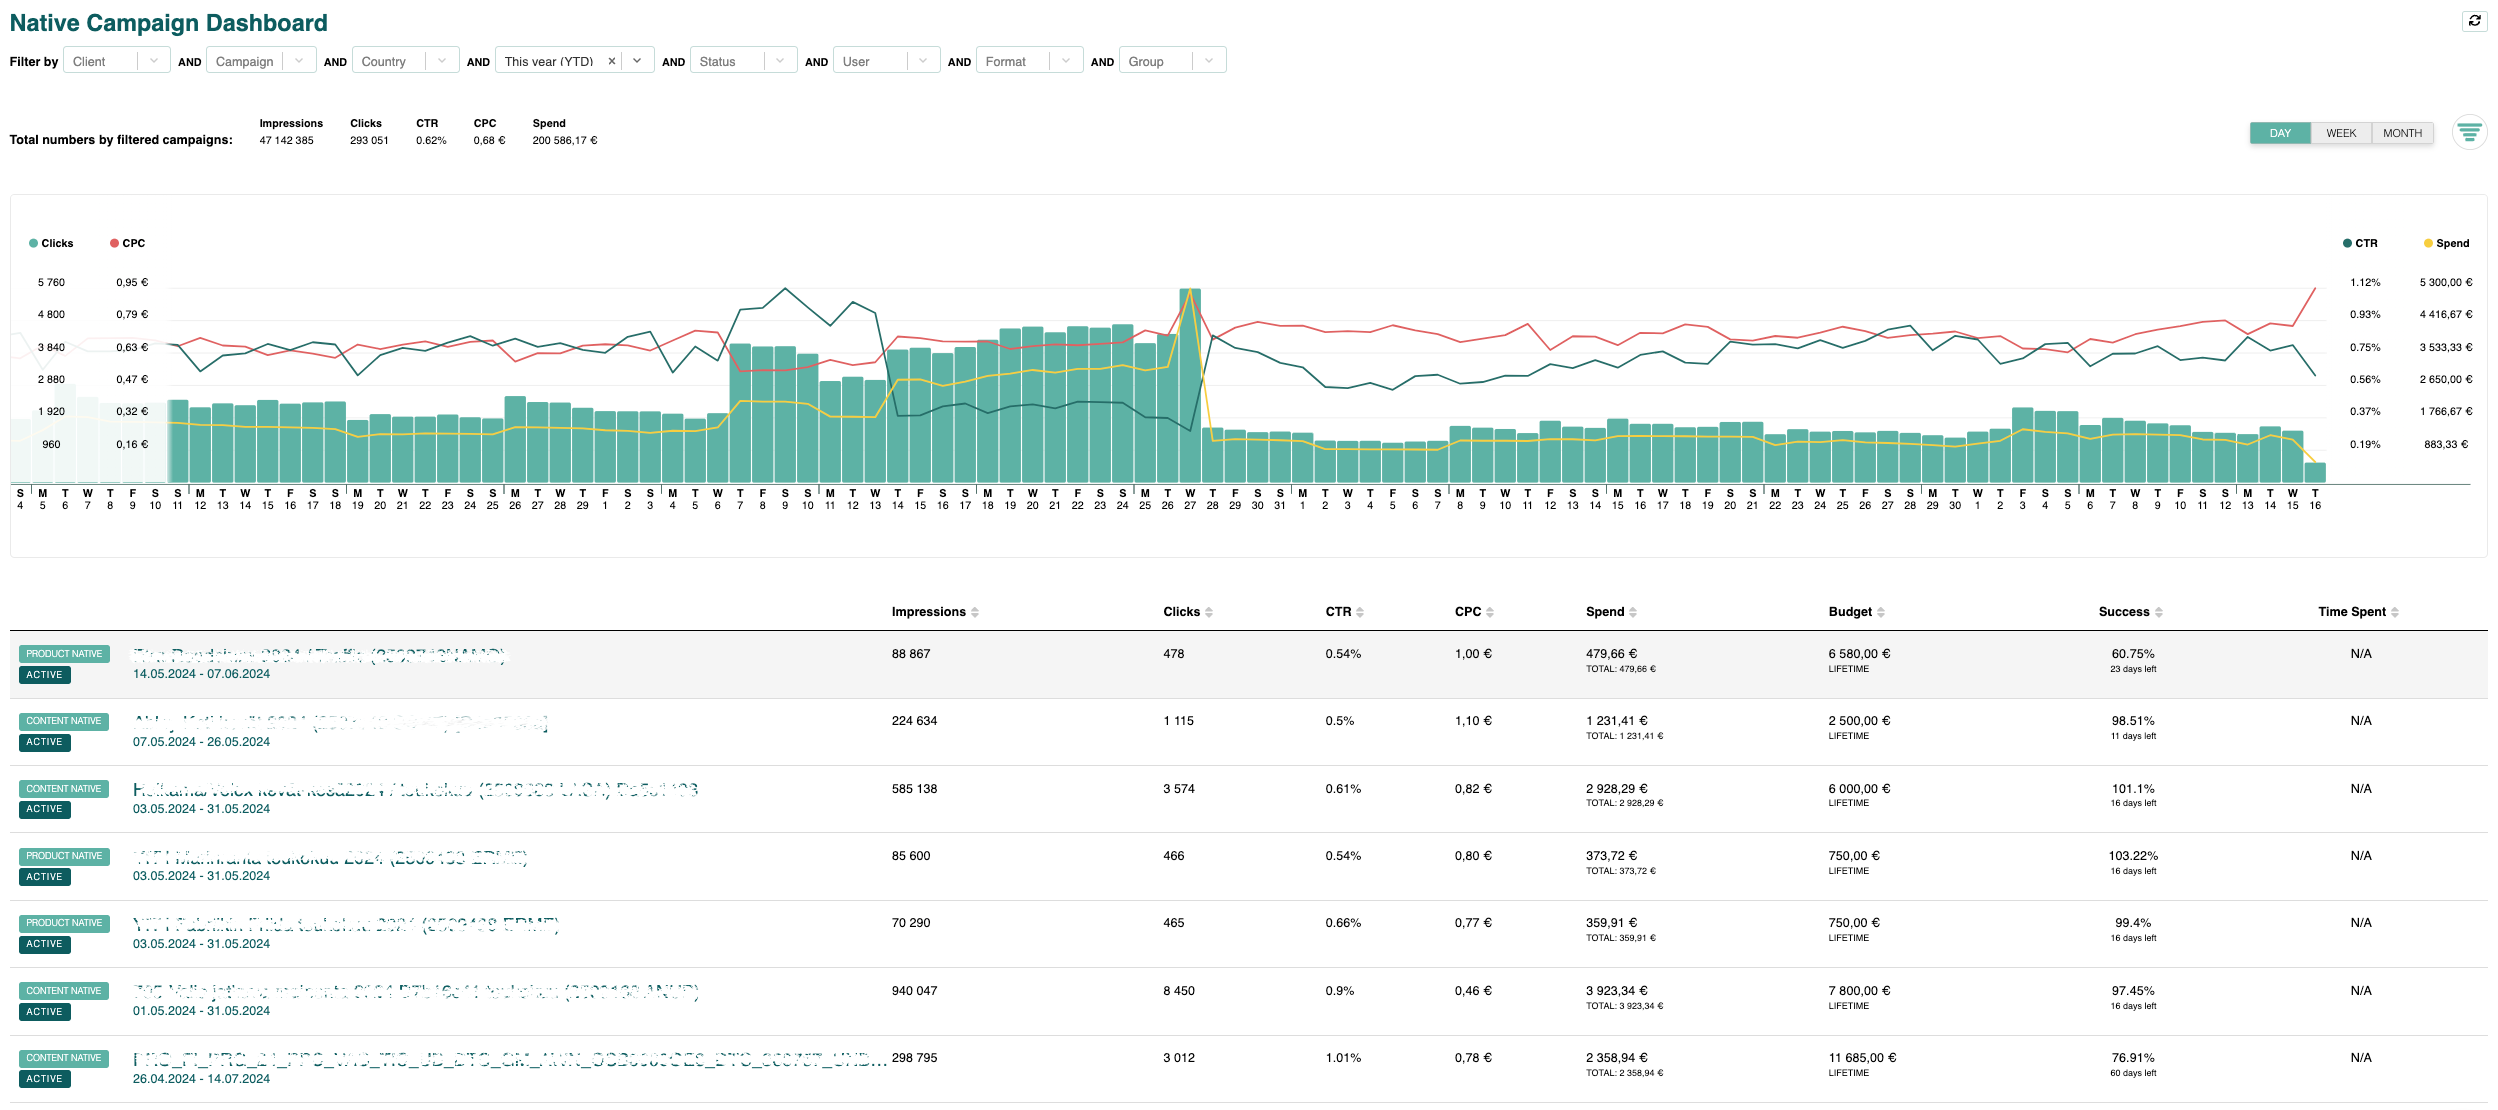
Customizable graph data
Adjust the graph to show daily, weekly, or monthly views, helping you visualize performance over different time frames.
Flexible filtering options
Filter campaign data by dimensions such as client (for agency accounts), campaign, country, timeframe (default: last 60 days), status (active, inactive, ended), user, and format. This helps you focus on the metrics that matter most to your goals.
Comprehensive visualization
View key metrics, such as impressions, clicks, CTR, CPC, CPA, conversion rates, time spent on site, and goals achieved, in an easy-to-read graph format.
Campaign-level insights
For more detailed insights, the campaign-level view provides an in-depth look at individual campaign performance, which allows you to fine-tune your strategies for maximum impact.
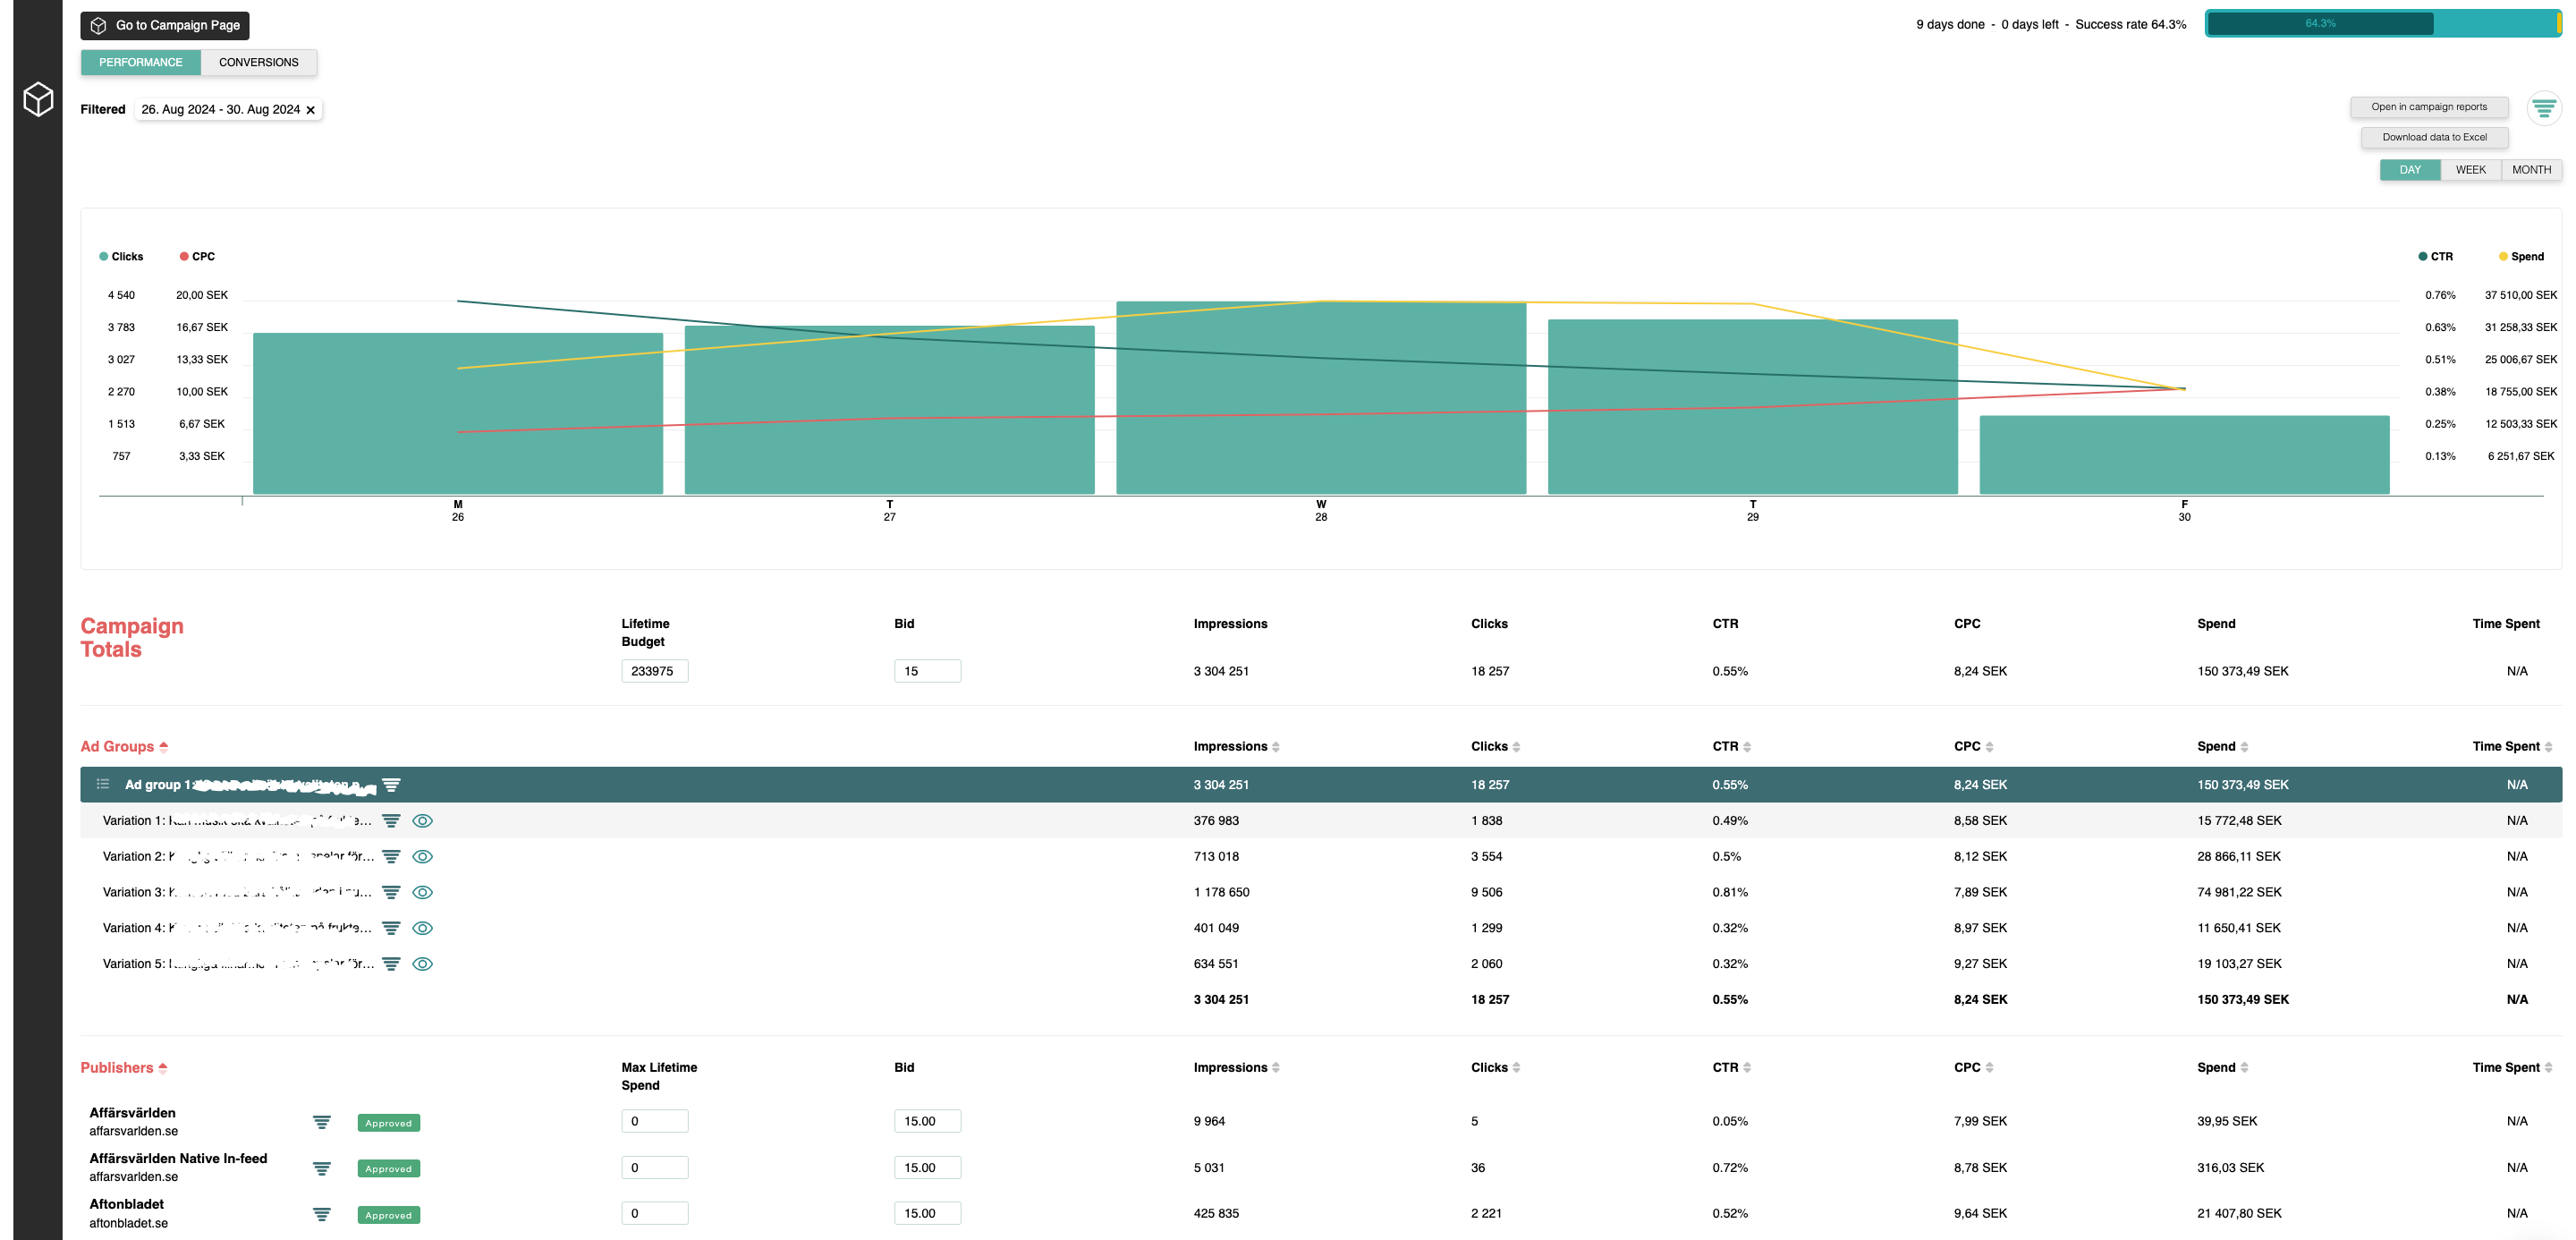
Navigate to campaign page
Easily transition to the campaign page to adjust media selections, targeting, bid prices, and other parameters.
Download campaign data
Export filtered campaign data to Excel or use the Report Builder to generate customized reports tailored to your needs.
Advanced filtering options
Drill down into specific metrics, such as device type, timeframe, creatives, and sites/publishers. This enables you to analyze performance at a deeper level.
Maximize bid optimization
Adjust maximum bids per site and monitor the status of your bids (active, draft, disapproved) alongside performance metrics.
Manage creatives
Activate, deactivate, or edit creatives directly from the campaign view. This makes it easy to test new visuals or pause underperforming ads.